Vista GeoScience Subsurface Imaging Systems
for High Resolution Site Characterization (HRSC)

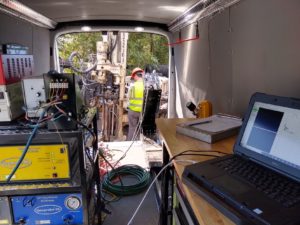
Hydraulic Profile Tool (HPT) and Electrical Conductivity (EC)
- Injection Flow measures Pressure (P) and Flow (Q), Calculates Permeability (K)
- Measures Head, Groundwater Elevation
- EC identifies grain size and ionic compounds
- Also calculates groundwater Specific Electrical Conductance (SEC)
The Membrane Interface Probe (MiHPT)
- For Measuring VOCs, dissolved and sorbed in the soil
- Standard MiHPT for ppm level VOCs
- Low-Level MiHPT for ppb) level VOCs
- Integrated HPT & EC
Optical Image Profiler (OiHPT)
- For Measuring Petroleum LNAPL or DNAPLs
- OiHPT-UV: Ultra-Violet Source for Fuels, Lighter Oils, etc.
- OiHPT-G: Green Laser Source for Heavy Crude, Creosote, Coal Tar, etc.
- Integrated HPT & EC
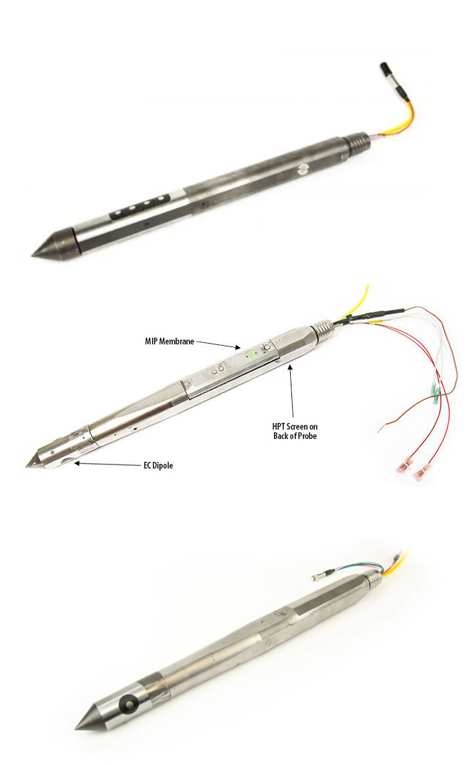
Membrane Interface Probe (MIP or MiHPT)
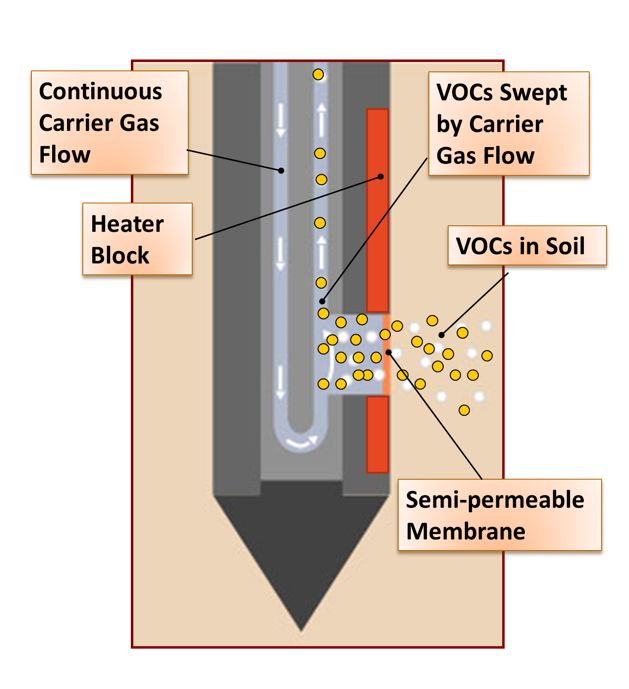
The MIP tool is for measuring VOCs in the soil and groundwater. As the tool is pushed through the soil and groundwater, VOCs enter the tool through the membrane and are carried to the detector instruments at the surface via the trunk-line. Integrated into the tool is also the Hydraulic Profile Tool (HPT) for measuring permeability, and the Electrical Conductivity (EC) Dipole for identifying lithology and ionic compounds.
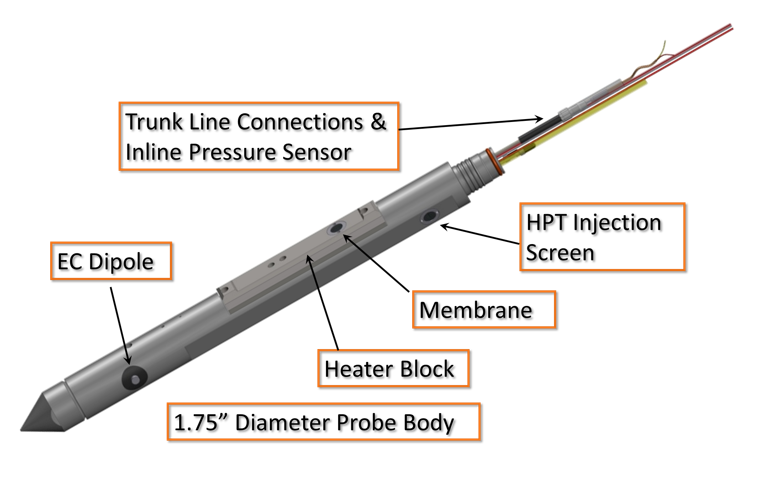
How it Works
VOC Detectors
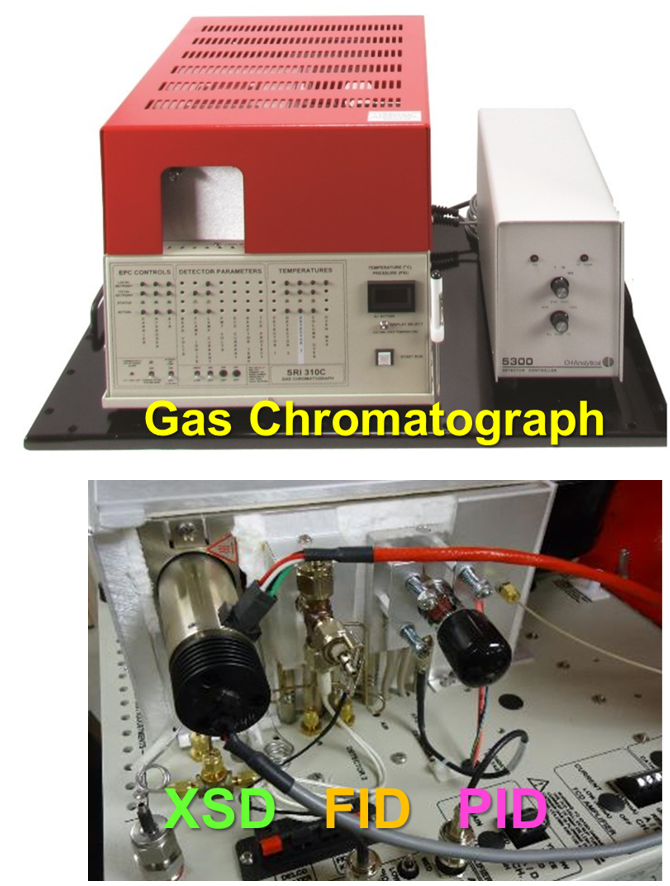
A field ruggedized gas chromatograph, built specifically for the off-road MIP system, houses three types of detectors:
Flame Ionization Detector (FID)
- Anything that burns (& ionizes) in a flame.
- Widest linear range (several ooms)
- All hydrocarbons including methane, alcohols, ketones, chlorinated solvents (weakly)
Photo Ionization Detector (PID)
- Sensitive to Double Bonds, alkenes
- BTEX, Naphthalene, PCE, TCE, DCE, etc. (alkenes, but no alkanes)
Halogen Specific Detector (XSD)
- Sensitive, low noise, & wider range than ECD
- Selective to Halogens: Chlorine, Bromine, Fluorine, etc.
- PCE, TCE, DCE, VC, TCA, DCA, EDB, Freon, etc. (both alkenes and alkanes)
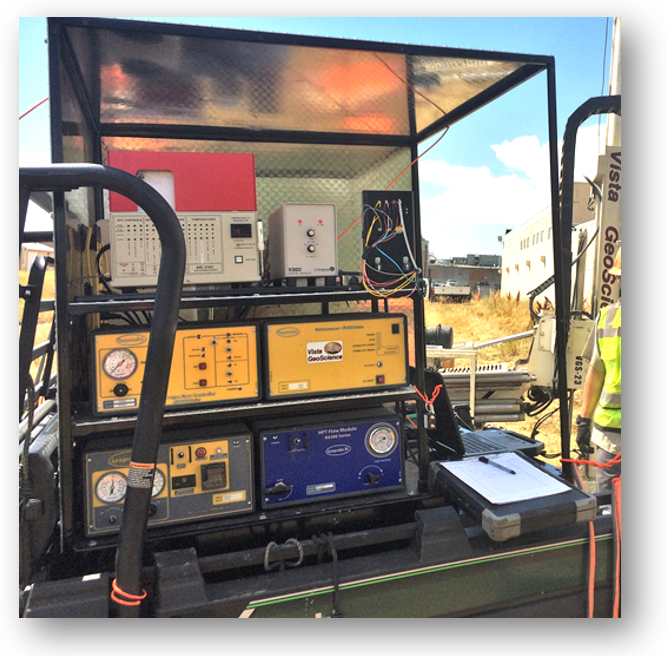
NEW Self-Contained & Portable Instrumentation Rack
Holds all HRSC Instrumentation
- MIP / LL / HPT / OIP Controllers
- Gas Bottles (below deck)
- Large Water Tank (for HPT Injection)
Quick Connect Trunk-Line Panel
Rugged/Sensitive VOC Detectors:
FID, PID, XSD
Ruggedized Field Computer
Very Portable, Air Freight Ready
Holds all HRSC Instrumentation
- MIP / LL / HPT / OIP Controllers
- Gas Bottles (below deck)
- Large Water Tank (for HPT Injection)
Quick Connect Trunk-Line Panel
Rugged/Sensitive VOC Detectors:
FID, PID, XSD
Ruggedized Field Computer
Very Portable, Air Freight Ready
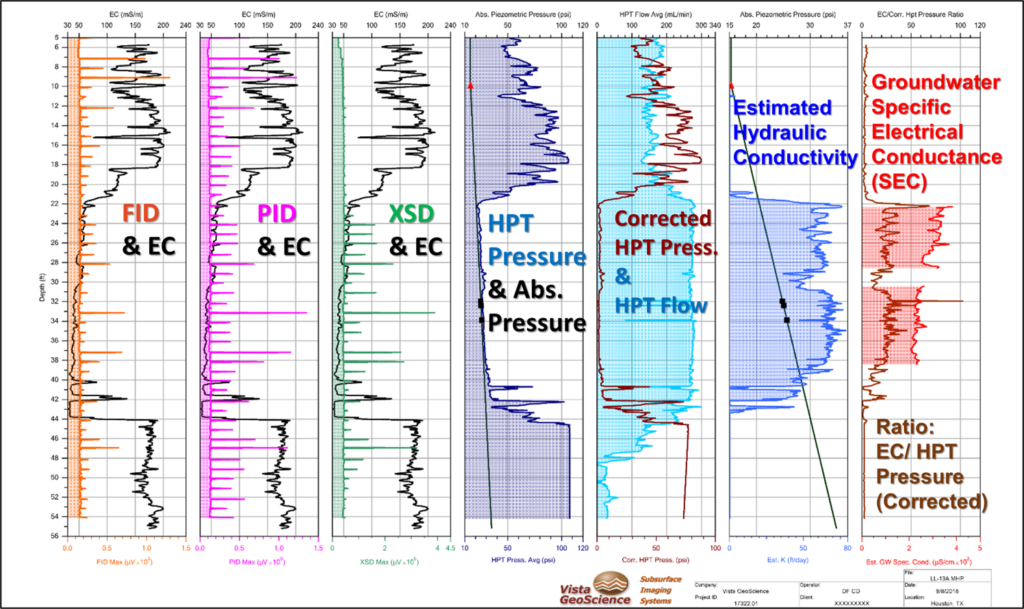
A Low-Level MiHPT Log Showing Data Collection at 20 Points Per Foot
This Low-Level MiHPT log is displaying 11 different parameters from a single 55-foot MiHPT log push. Some values are sensor responses, such as the VOC detectors (PID, FID, XSD), electrical conductivity (EC), injection pressure and flow, while other values are calculated, such as Corrected HPT Pressure, estimated hydraulic conductivity (K), and Groundwater Specific electrical conductance (SEC).
The results of the dissipation tests conducted at 32-34 feet show that the groundwater table is at 10 feet, and allows the software to calculate K and SEC. The log indicates the presence of potential aromatic hydrocarbons starting at 7 feet, then chlorinated solvents appear in the sand channel starting at 24 feet.

Optical Image Profiler (OIP or OiHPT)
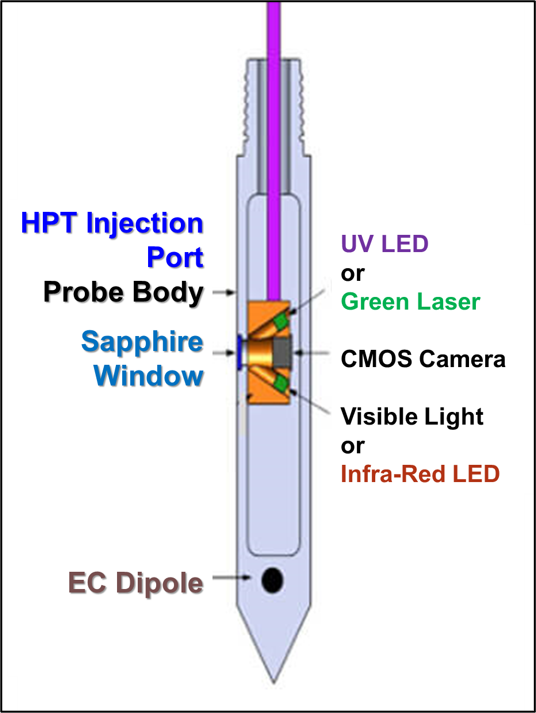
The Optical Image Profiler (OIP) tools detects the PAHs in petroleum mixtures by capturing fluorescent images of the product under a UV or Green light source. It will only detect free phase product that comes in contact with the sapphire window and will not see dissolved or sorbed compounds. In combination with the HPT and EC sensors, the hydrostratigraphy is identified on the same log, showing the permeable pathways and confining lithologies.
OiHPT-UV for Fuels, Lighter Oils:
Ultra-Violet LED Light Source - Similar Response as LIF/UVOST
OiHPT-G for Heavy PAHs: (tar, creosote, crude, etc.)
Green Laser - Similar Response as LIF/TarGOST
White LED or Infrared LED for Images of Soil
Both are Integrated with HPT and EC
OIP-UV Images
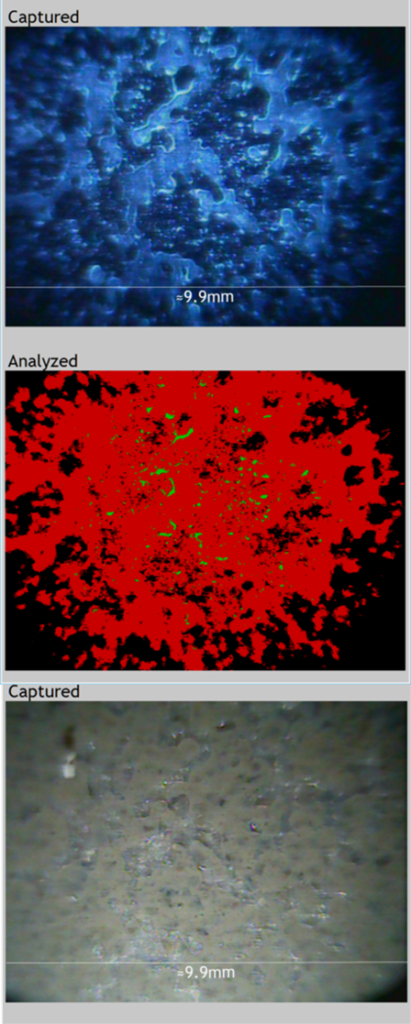
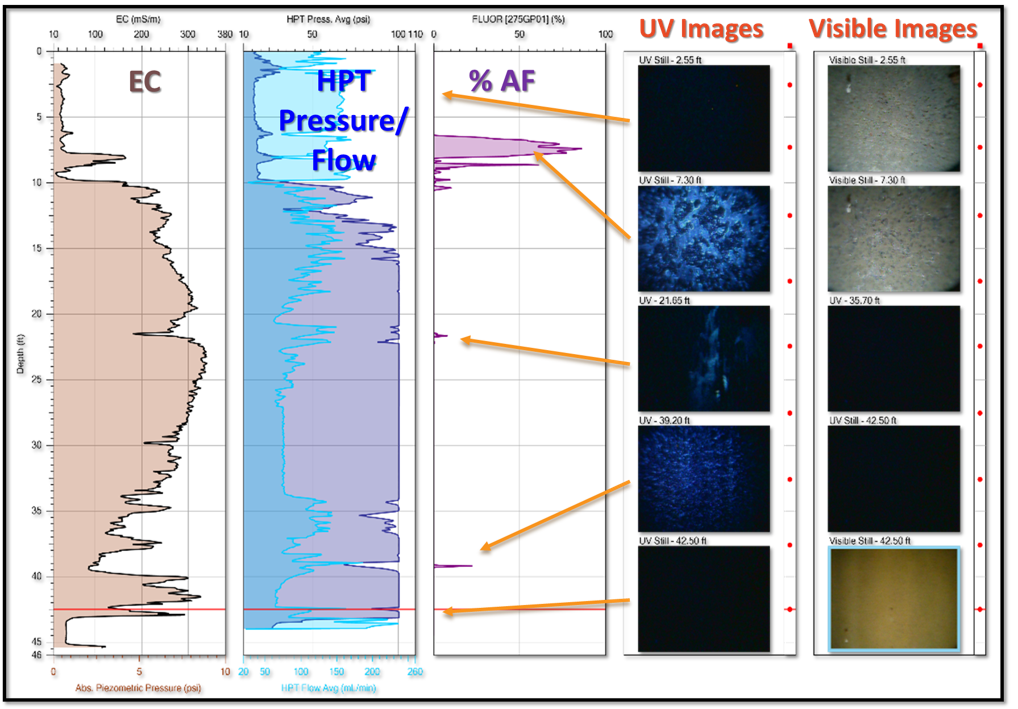
As the tool is pushed through the soil, a UV LED light source excites the aromatic hydrocarbons in the pore space, and images of the resulting fluorescence are captured an analyzed every 0.05 feet. The top images is the actual fluorescing hydrocarbons seen through the sapphire window. The next images (red) is the analyzed percentage of the area fluorescing. The bottom image is under the white light, showing the texture of the sandy soil.

As the tool is pushed through the soil, a UV LED light source excites the aromatic hydrocarbons in the pore space, and images of the resulting fluorescence are captured an analyzed every 0.05 feet. The top images is the actual fluorescing hydrocarbons seen through the sapphire window. The next images (red) is the analyzed percentage of the area fluorescing. The bottom image is under the white light, showing the texture of the sandy soil.
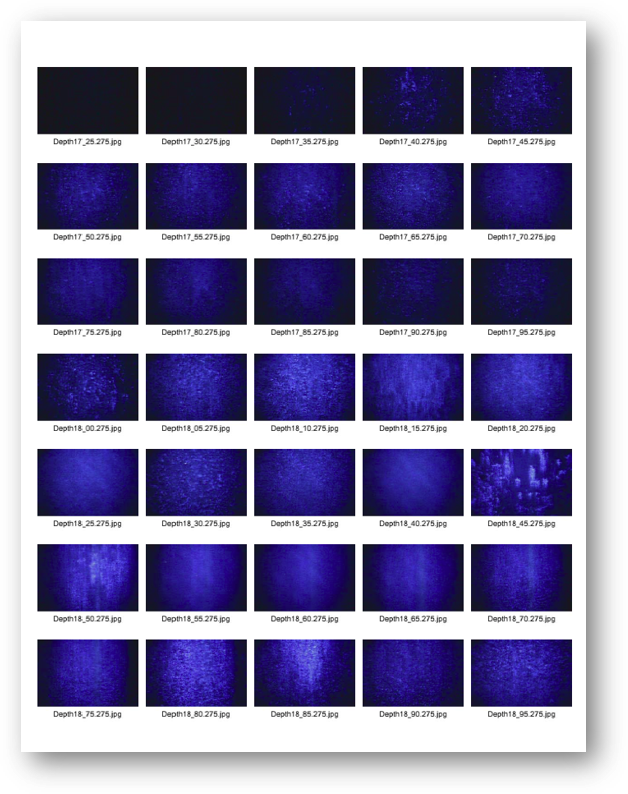
An image is captured every 0.05 feet and can be reviewed in the DI Viewer software and can be examined for quality control purposes.
Images can also be printed to a contact sheet as seen here
An image is captured every 0.05 feet and can be reviewed in the DI Viewer software and can be examined for quality control purposes.
Images can also be printed to a contact sheet as seen here
Typical OiHPT-UV Log
The OiHPT tool allow the identification of Non-Aqueous Phase Liquids (NAPL) at thin as 0.05 feet, logged as Percent Area Fluorescence (%AF) while also mapping the hydrostratigraphy at the same high resolution. Images of the NAPL fluorescence are captured every 0.05 feet, and optionally a visual image of the soil texture can be captured as well.
Real Time Data, Reporting, and 3D Modeling
Vista provides real time data from the field to your desktop for immediate review and collaborative decision making. Because of our extensive experience interpreting HRSC data from these tools and using the data in 3D modeling software, our final reports are praised by our clients for the level of detail and quality. Our reports include:
- Real-Time Field to Desktop Logs and Maps via Cloud Server
- Interpretive Project Narrative
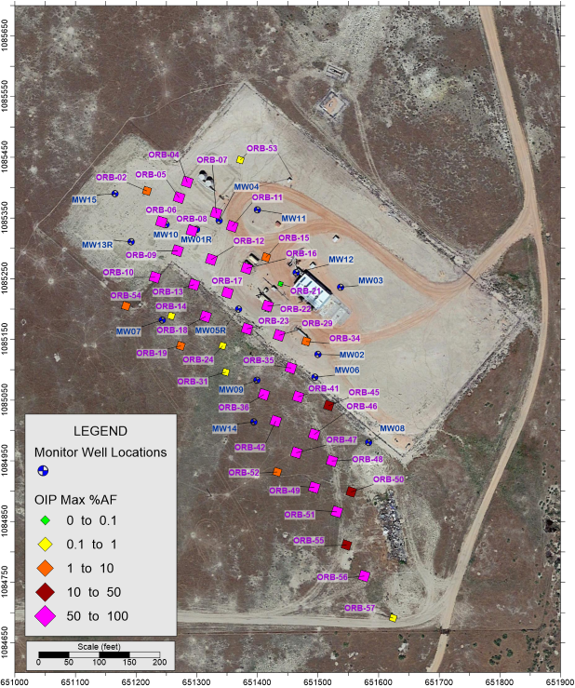
- Boring Location Map and Posted/Contoured Maximum Response Values
- Log Cross Sections
- Final Edits of Logs in Multiple Scales
- Summary Tables of Response, Operational Notes
- QA/QC and Response Test Review
- Comparison of Responses to Confirmation Lab Results
- Quarterly Multi-Point QC Response Tests Reports
- All Digital Log Files and/or exported log data, DI Viewer Software

Advanced 3D Model Visualization Reports
Vista’s Optional 3D Modeling Reports provide not just a cool looking image or animation, but a complete detailed interpretive model and report in a power point presentation format. The model integrates all other site data with the HRSC response and includes:
- Surface Image and Elevation Model
- Groundwater Surface Elevation Model
- Isopeth Maps of PID/FID/XSD Maximum Concentration Values
- Hydrology/Hydrostratigraphy Models from HPT/EC/K Data
- LNAPL or DNAPL Isosurface Models show NAPL distribution
- PID/FID/XSD Response Isosurface or Point Cloud Models
- Monitor Wells and Confirmation Borings with Posted Data
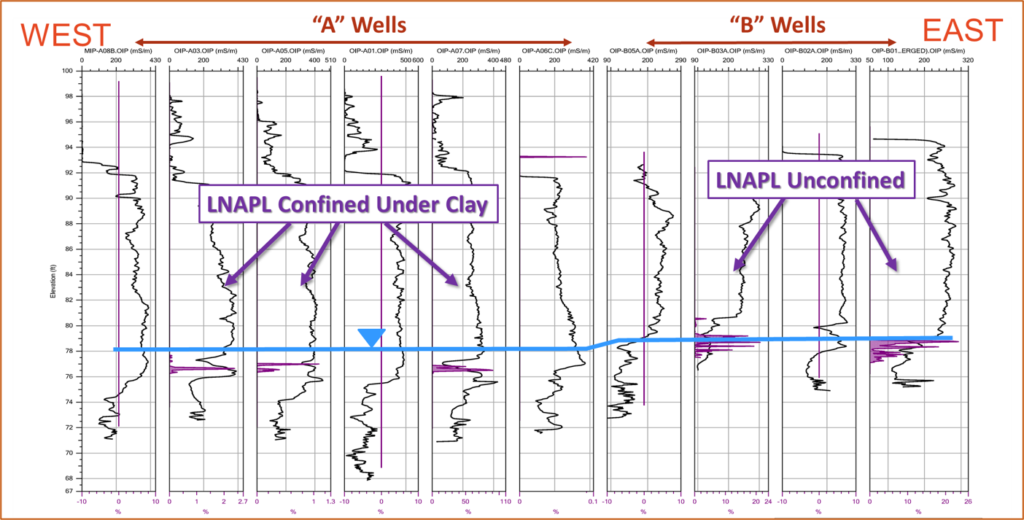
Confined and Unconfined Gasoline LNAPL in Old Downtown Area.
2D Cross Section of OIP Logs showing LNAPL and EC Response. At west end of cross-section, the LNAPL is confined in a thin sand (low EC response) under a tight clay (high EC response) and on the east side, the LNAPL is floating at the groundwater table, unconfined, where the sand is present at a higher elevation. Where the LNAPL was confined, LNAPL was up to three feet thick, giving a false impression of the amount of LNAPL present.

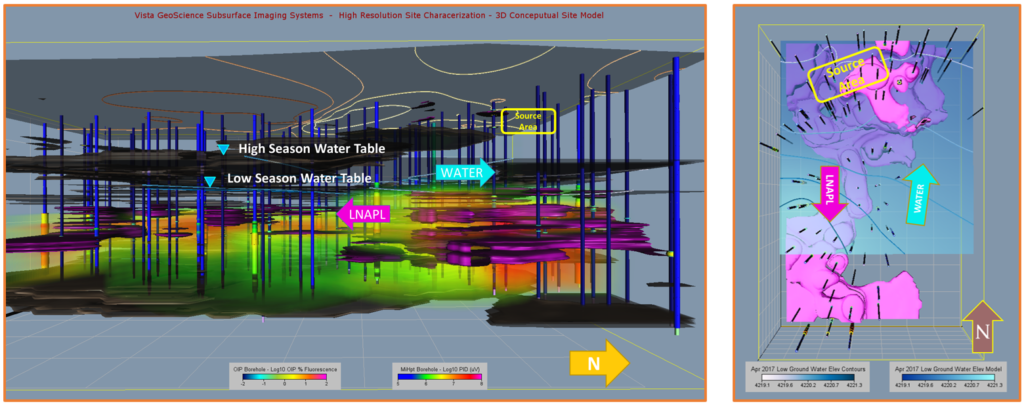
Confined Gasoline LNAPL Migrates Opposite of Groundwater Flow
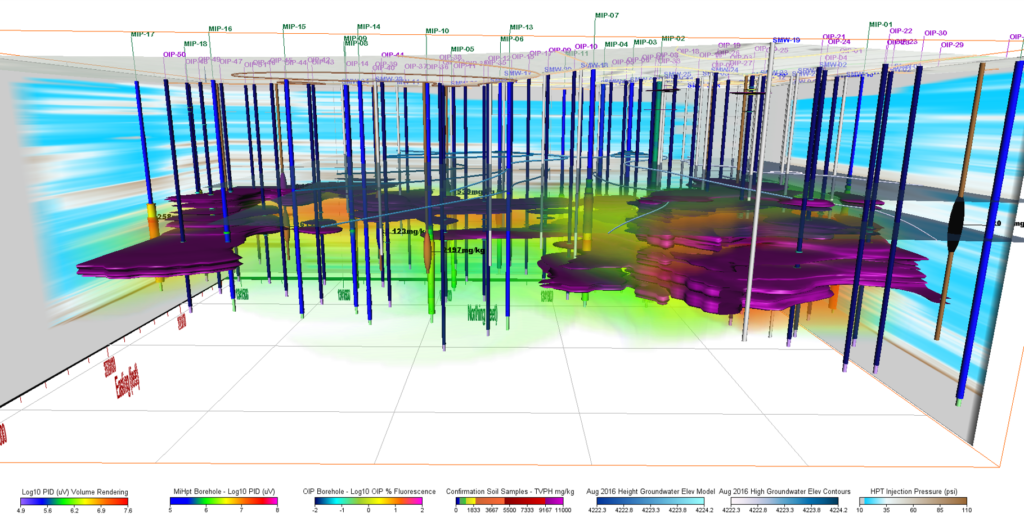
This 3D visualization model identified migration of a gasoline LNAPL plume moving opposite direction of the ground water gradient, confined below the lowest water table by lower permeability zones. The model consists of 51 OIP-UV borings, 18 MiHpt, 10 confirmation soil borings, and all of the site monitor wells (not displayed). The LNAPL is shown as the magenta colored isosurface, and the MiHPT-PID response is a rainbow-colored point cloud with the warmer colors showing higher values. The dark brown isosurface layers represent lower permeability zones interpreted from the HPT injection pressures.
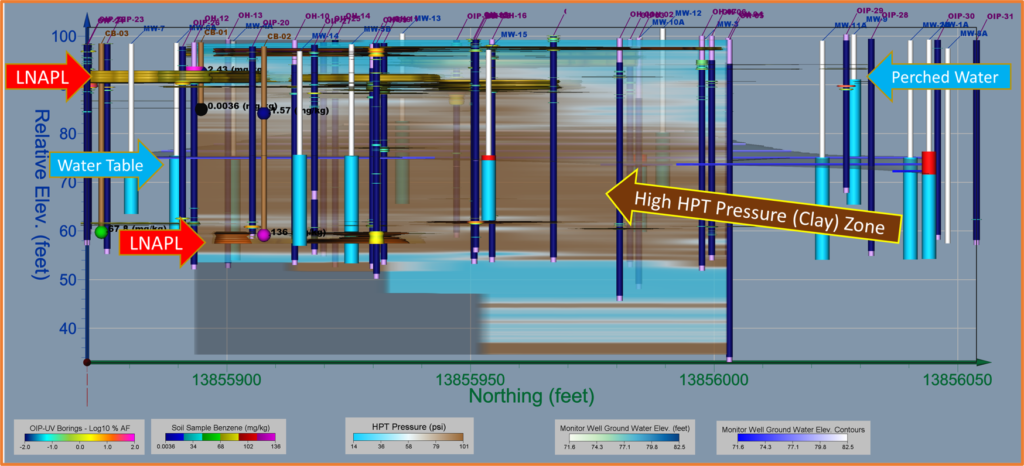
Perched and Confined LNAPL at Abandoned Gas Station
This is a cross-sectional perspective view of a 3D model at an old gas station release site showing OiHPT-UV borings and fluorescence data, HPT injection pressure, the groundwater elevation model, and monitor wells. The HPT-pressure indicates a tight clay from about 90’ to 60’, and more permeable strata above and below that clay. This created a perched water condition where the majority of LNAPL resides, but LNAPL found its way down to zones about 40-45 feet below the surface. This may have been induced by numerous wells left on site with screens extending from 5’ bgs to 50’ bgs.
Chlorinated Solvents at Manufacturing Facility
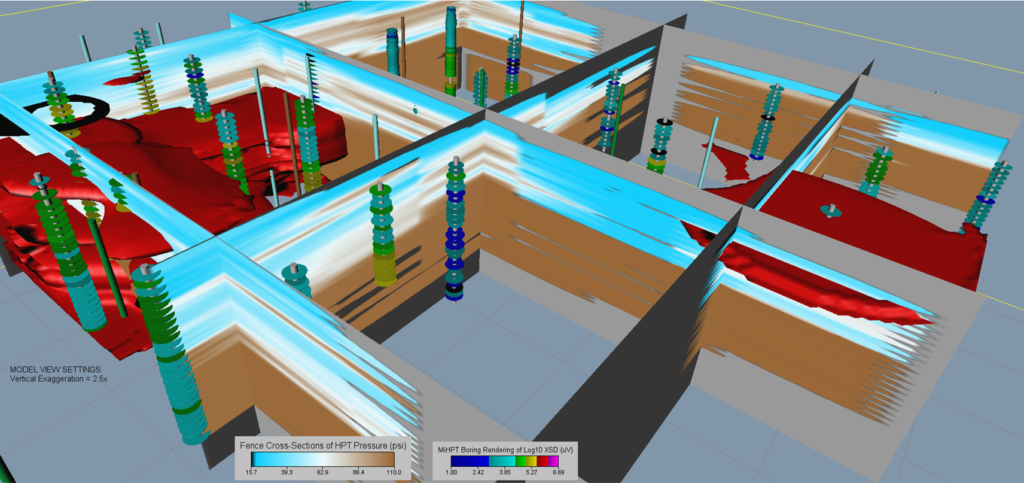
This 3D model shows the results of a Low-Level MiHPT survey at a manufacturing facility. The 3D fence diagrams represent the HPT-pressure showing a tight clay (brown) at depth with more permeable zones above. The XSD detector response >250 millivolt is shown as a red isosurface indicating a dissolved phase chlorinated solvent, confined mostly in the tighter clays.
